

Programming Language: Python [Link App]
1. Problem statement
2. The solution
2.1. Building an application
3. Application’s features
4. Future work ideas
5. Code source
We sometimes might find daily, weekly and monthly reports that consume (and make us waste) much time with repetitive tasks.
In the following case, we found a daily report that consumed at least 30 minutes daily. The source of data for this report comes from an ERP system. The person building the report was supposed to download data from it and do some transformations based on the report format, i.e., filtering, getting pivot tables, drawing some charts, unpivoting tables, and pasting everything into a PowerPoint file - as shown in the flowchart below. Once this report was ready, mistakes must have been avoided, which meant a double check and more time wasted. Then, the report could be sent to the corresponding managers at the mine operation. Therefore, this report should be done every single day until it is not needed (it might not happen, though).
 |
|---|
| Process of doing a daily report |
Furthermore, we also found that this “reporting person” was supposed to do a weekly and monthly report with a similar format. However, building these two was more cumbersome than the daily report. There were many gaps to fill out in an Excel file and numerical values that needed to be checked multiple times because these were sent to a corporate office (see the flowchart below). In practice, there is always a mistake when dealing with multiple computations simultaneously. To be more chaotic, if the “reporting” person was asked to share the Excel file from previous reports, that was his/her end because they would need to build it again.
 |
|---|
| Process of doing a weekly/monthly report |
Then, how can we automate this process and make life easier for this reporting person? What can make us focus on the actions brought from these indicators rather than computing them?
We thought about building a web dashboard so that it conveys the daily, weekly, and monthly reports. That way, each manager at the mine site could access this information in real time.
For the daily, there is still a manual process - the “reporting person” should download a file for the current date. Once this is done, this should be uploaded to the web system, and that would be it! There is a chance to build a task scheduler that automatically downloads it from third-party software, but this is still in development. In addition, on the side of the weekly and monthly report, the only manual process would be to feed the source data, as shown in the flowchart below.
 |
|---|
| Prospective solution |
The dashboard is built using the Streamlit framework in Python, and there are two primary components of this prospective app that may need to be described.
1- Uploading and updating the Excel parent file for a daily report.
For this case, a .txt file containing the names of the files already saved in the parent file, i.e., SHEC-2020_Aug_2.csv, would help us check if the uploaded file is already in the Excel parent file. If the filename is not there, it will be merged with the Excel parent file; otherwise, it will be avoided.
# Text file path
dir_txt_file = r"...dates.txt"
# Folder path - this is where you will download your "newest"
dir_csv_files = r"..dir_of_your_files"
# Read text file
dates_in_txt = np.loadtxt(dir_text_file, dtype='str')
# Check if the "newest" file is already in the txt file. If so, names will be added to a list
csv_files_left = [csvfile for csvfile in os.listdir(dir_csv_files) if csvfile not in np.loadtxt(dir_text_file, dtype='str')]
# Merge files in the list with the parent file.
for csv_left in csv_files_left:
    pd_csv_left = pd.read_csv(dir_csv_files+csv_left)
    all_hazards = pd.concat([all_hazards, pd_csv_left], ignore_index=True, sort=False)
    file =  open(dir_text_file,'a')
    file.write(csv_left+'\n')
    file.close()
# Save the merged Excel file
all_hazards.to_csv('AllHazards.csv', index =False)
2- Fixing the process of reading data when the website is being clicked.
Streamlit offers a function decorator, @st…, that bypasses this process (if stated). The following is written explicitly in the application.
@st.experimental_singleton
def read_files(new_hazards_file='a'):
    """
    Read the source data for daily, weekly and monthly reports.
    Args:
        new_hazards_file (str or dataframe): Help see if there is a new
                            hazard file. This plays with the function
                            decorator in line 25.
    Returns:
        Main (class): Instantiate a class that got multiple objects."""
    Main = back_.CargaReports(new_hazards_file)
    return Main

class CargaReports:
    """
    Load 3 main files for daily (03_AllHazrds),
    weekly and monthly (the other 2)
    """
    def __init__(self, newhazard=0, file_hazards="03_AllHazards.xlsx",
                file_incidents="01_Accidents_Fill.xlsx",
                man_hours="02_ManHoursWorked.csv"):
        ...
        ...
This application has multiple features for a daily side:
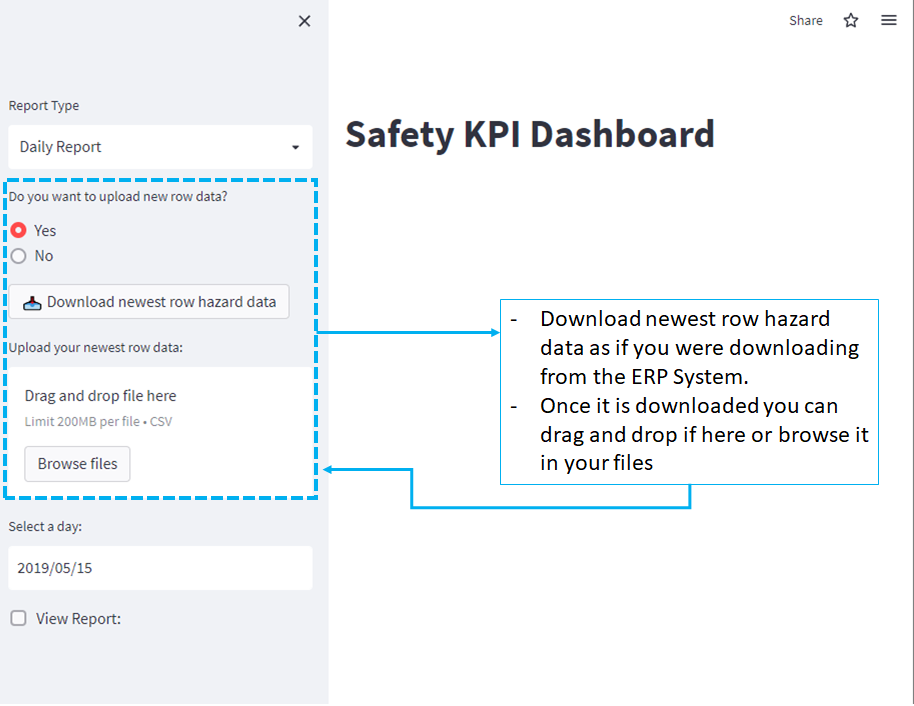 |
|---|
| Download and upload newest raw data for a daily report |
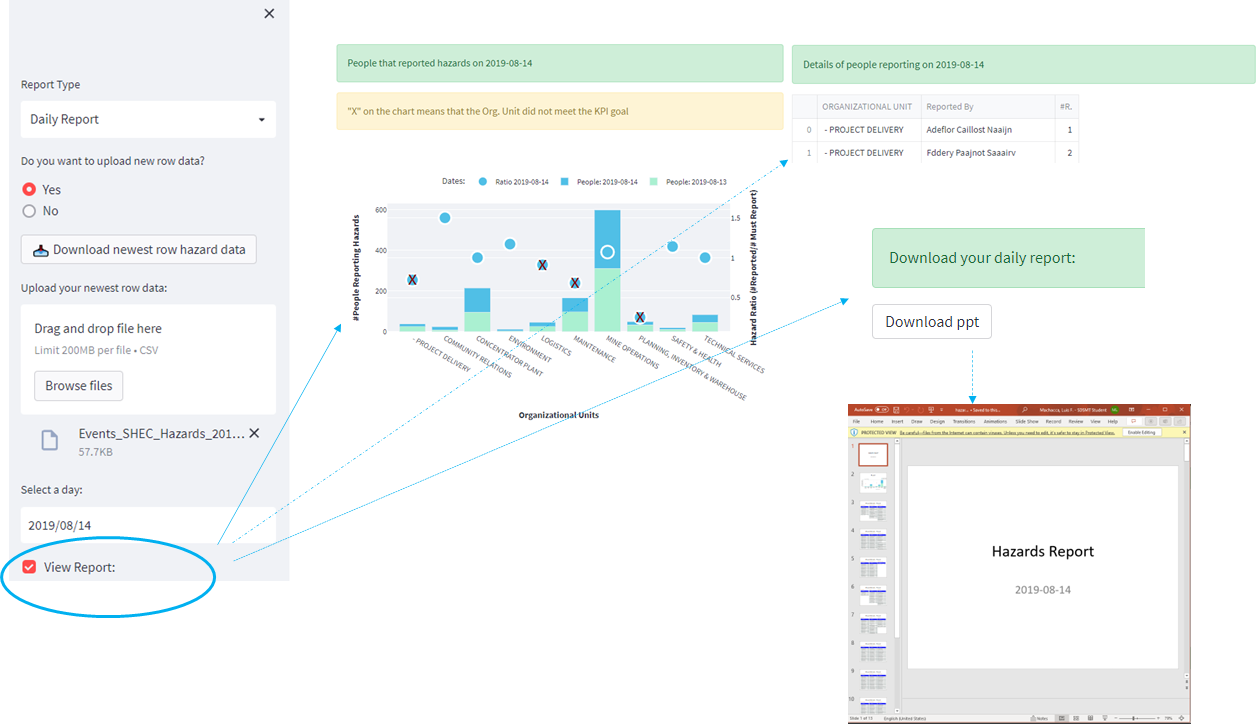 |
|---|
| Daily report content |
Downloaded power point file - this will be similar as shown in the web dashboard, but it is ready to be sent to other people.
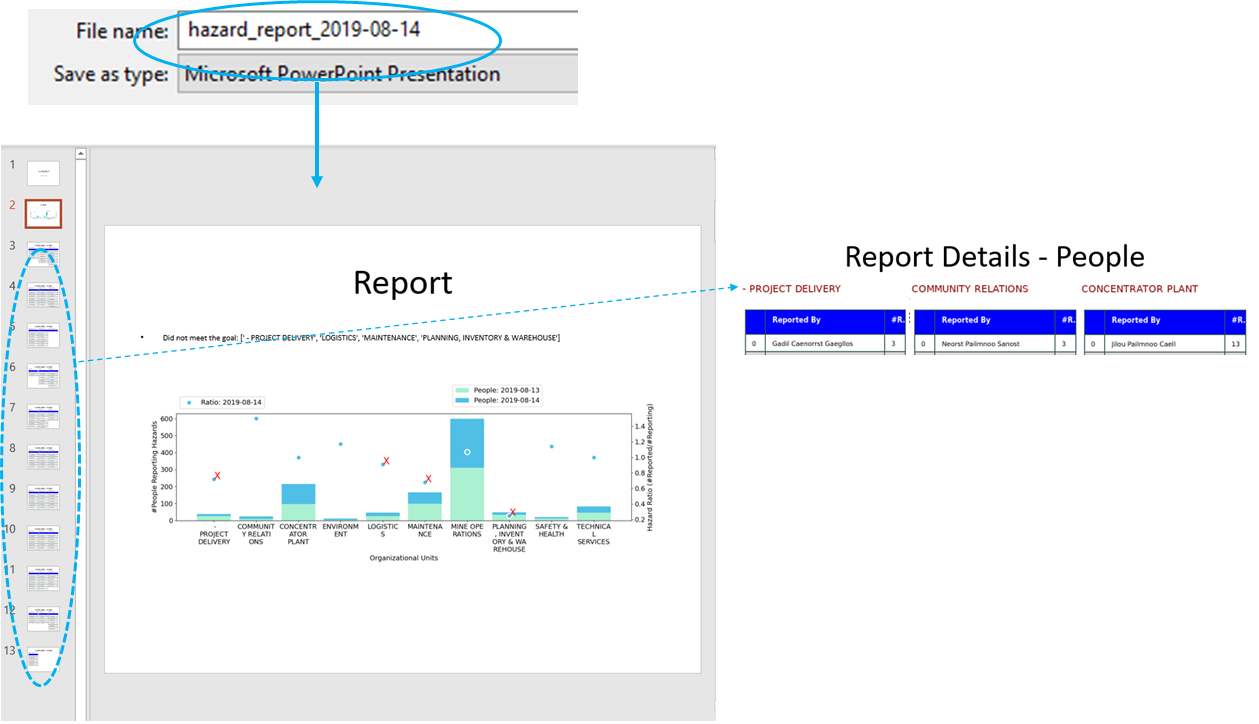 |
|---|
| Downloading a power point file report |
In addition, we have the following design for the weekly and monthly report.
For a weekly:
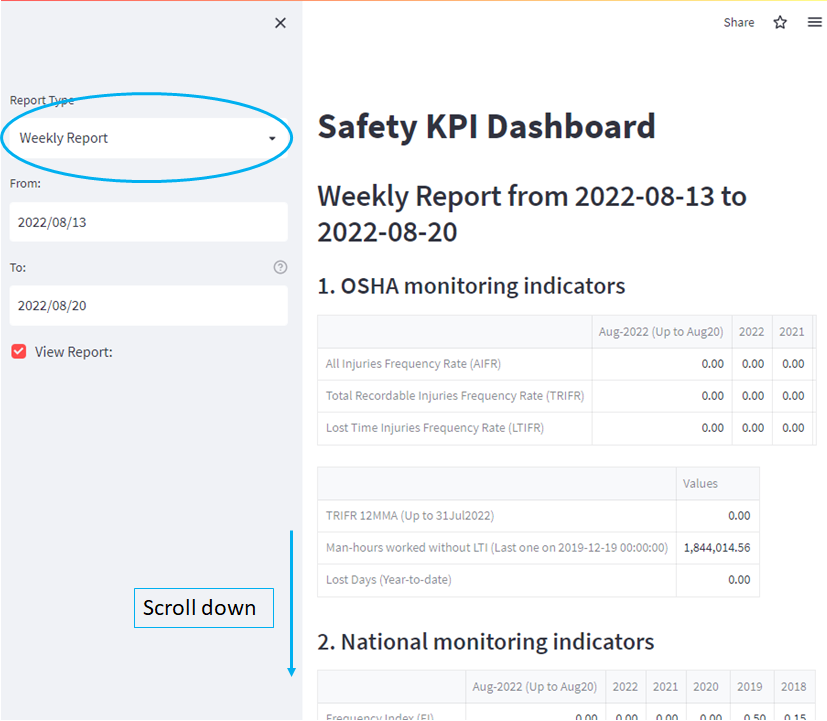 |
|---|
| Weekly report design |
For a monthly:
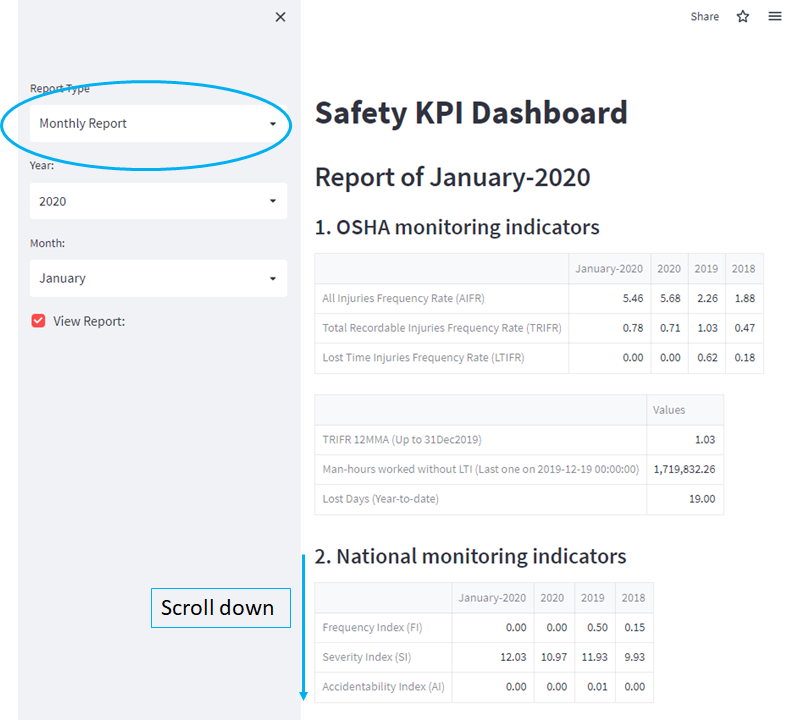 |
|---|
| Monthly report design |